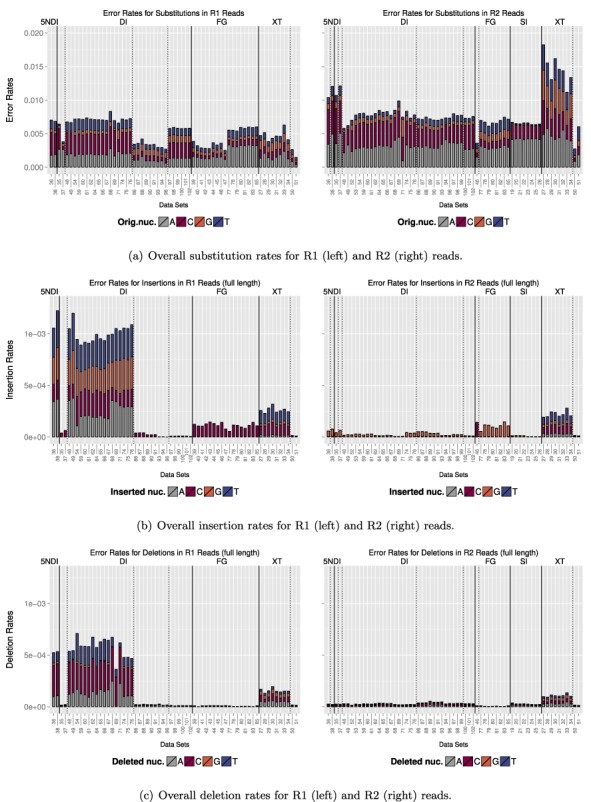
Figure 6.

We compared the overall error rates for each data set. The lower x-axis indicates the name of the data set and the upper x-axis specifies the library preparation method. The error bars show the extent that each original nucleotide contributed to the overall error rate. Data sets are grouped by library preparation (solid lines) and primers (dashed lines).
