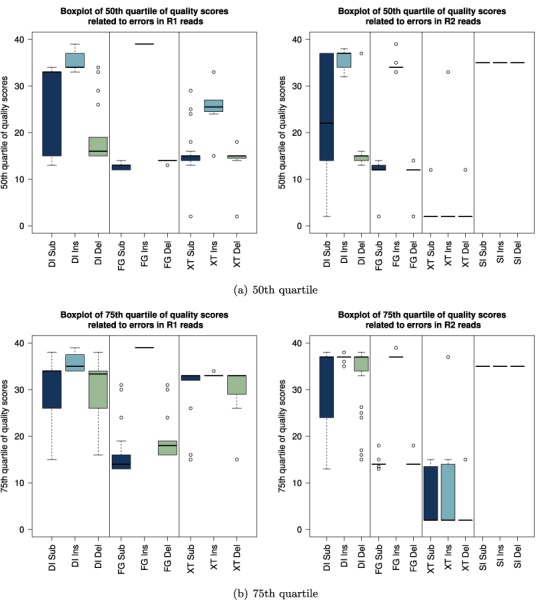
Figure 8.

Overview of 50th and 75th quartile of quality scores associated with errors across all data sets. The results for the R1 reads are displayed on the left and the results for the R2 reads are on the right. Data sets were grouped by library preparation method (DI = dual index; SI = single index; FG = Fusion Golay; XT = NexteraXT) and substitution, insertion and deletion errors are displayed separately. Note, that for none of the single index data sets enough R1 reads aligned to construct meaningful quality profiles (threshold = 1000 reads).
