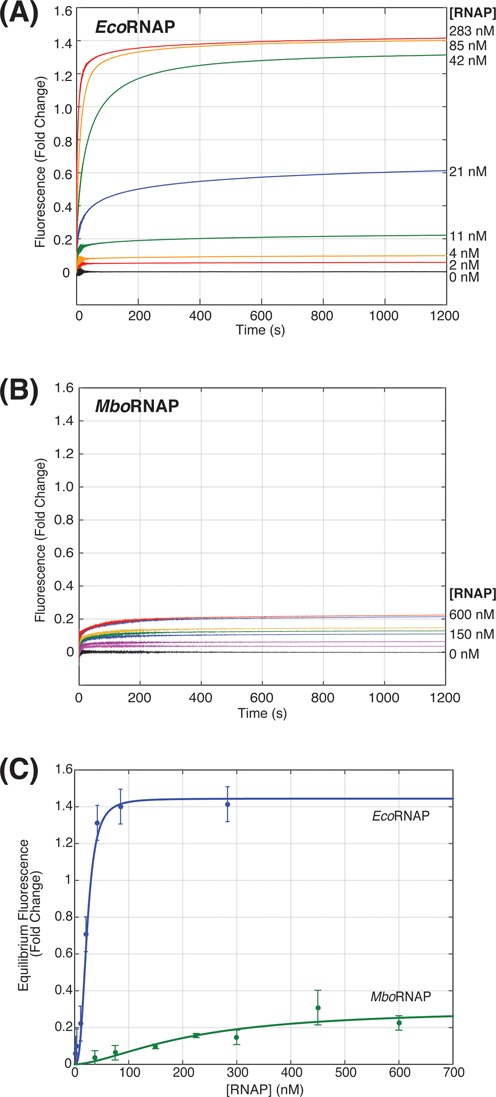
Figure 2.

RNAP concentration dependence of promoter opening. (A) Fluorescence enhancement as a function of time for increasing concentrations of EcoRNAP (0–238 nM). (B) Fluorescence enhancement as a function of time for increasing concentrations of MboRNAP (0–600 nM). (C) Equilibrium fluorescence fold change for both EcoRNAP and MboRNAP as a function of polymerase concentration. Fits (solid lines) of the data allow the extraction of concentrations of half-maximal effect (23 ± 5 nM and 212 ± 43 nM) and saturated fluorescence enhancements (1.44 and 0.28) for EcoRNAP and MboRNAP, respectively.
