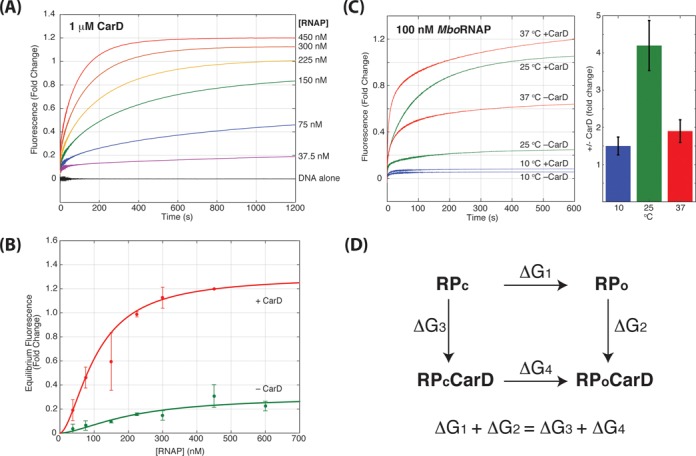
Figure 4.

MboRNAP titration at saturating CarD. (A) Fluorescence enhancement as a function of time for 1 μM CarD with increasing concentrations of MboRNAP (0–450 nM) at 25°C. (B) Equilibrium values of fluorescence enhancement fold change are plotted in the presence (red) and absence (green) of 1 μM CarD. The data were best fit with an amplitudes of 1.3 and 0.28 and Keff of 106 ± 3 nM and 212 ± 43 nM in the presence and absence of CarD, respectively. (C) Observed traces for 100 nM MboRNAP in the presence or absence of 1 μM CarD at 10°C (blue), 25°C (green) and 37°C (red). The bar graph shows the fold increase in equilibrium fluorescence enhancement for each temperature. (D) The thermodynamic cycle linking closed complex (RPc), open complex (RPo), closed complex bound to CarD (RPcCarD) and open complex bound to CarD (RPoCarD). The equality shown below follows since the sum of the free energy differences along the two paths from RPc to RPoCarD must be equal.
