
Figure 6.
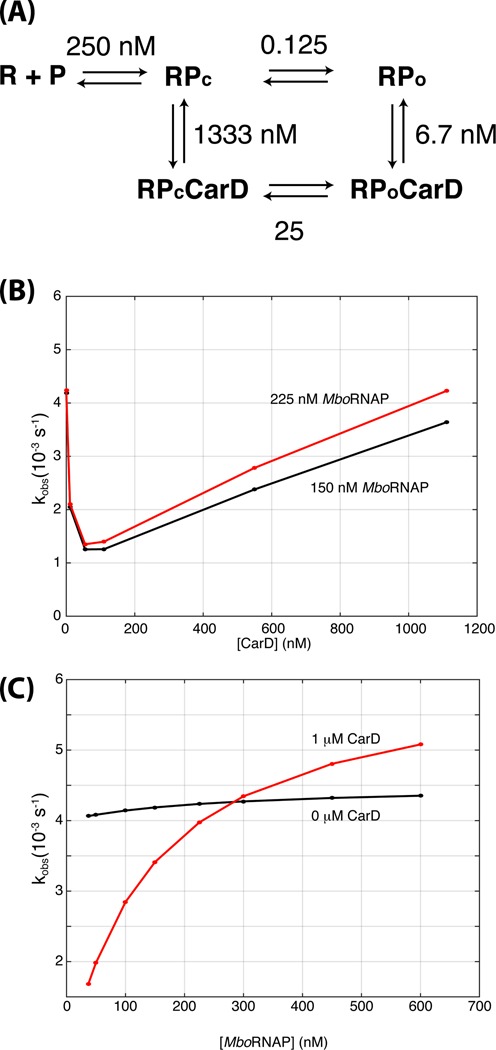
A CarD-dependent kinetic model of open-complex formation. (A) The model consists of five states: unbound DNA (R + P), closed complex (RPc), open complex (RPo), closed complex bound to CarD (RPcCarD) and open complex bound to CarD (RPoCarD). Values indicate the ratio of rate constants between each pair of states in the model. For example, at 250 nM, the forward and reverse rates between R + P and RPc are equal. Furthermore, the ratio of forward to reverse rates between RPc and RPo are 0.125 and 40 in the absence and presence of CarD, respectively. The rates used to generate the figures below can be found in Supplementary Information. (B) Simulations of the kinetic model titrating CarD concentration with 150 nM (black) and 225 nM (red) MboRNAP. (C) Simulations of the kinetic model titrating RNAP concentration with 0 nM (black) and 1 μM (red) CarD.