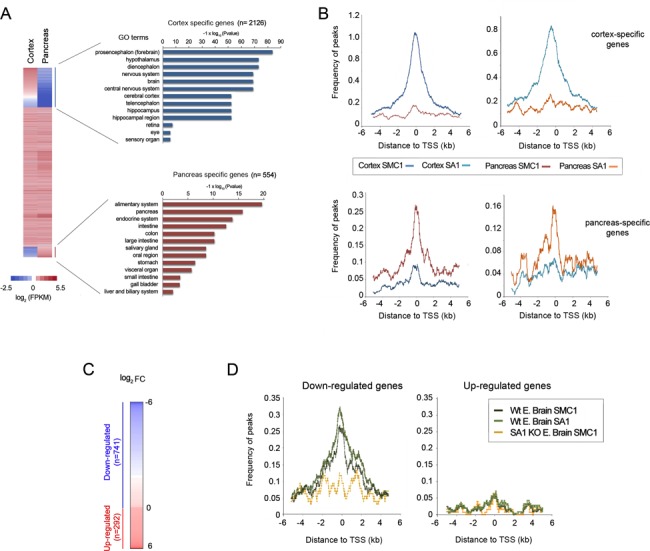
Figure 2.

Cohesin is enriched at the promoters of actively transcribed genes. (A) Transcriptional profiles from the cortex (left) and pancreas (right) of 10-week-old mice were determined by RNA-seq. Tissue-specific genes were selected for each tissue (see main text for details) and further confirmed by Gene Ontology analysis. (B) Cohesin distribution around the TSS (±6 kb) of genes expressed specifically in cortex (upper panels) and pancreas (lower panels) defined as peak frequency (%). Both SMC1 and SA1 distributions are shown. (C) Gene expression changes between wild-type and SA1 null brains (KO) from E17.5 embryos were characterized by RNA-seq (FDR < 0.05). (D) Cohesin distribution around the TSS of genes found to be down-regulated (left) and up-regulated (right) in SA1 null embryonic brains.
