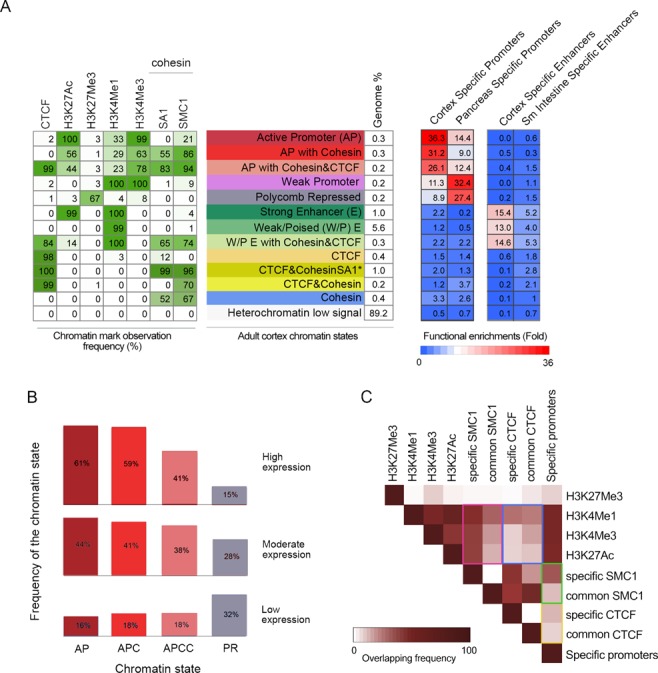
Figure 3.

Cohesin is present at active promoters and enhacers. (A) Chromatin profiling in adult cortex by means of Hidden Markov Model (HMM) led to define 13 chromatin states (shown in different colours) according to the observed frequency of different chromatin marks (H3K4Me1, H3K4Me3, H3K27Me3, H3K27Ac), CTCF and cohesin SMC1 and SA1. The numbers in the table on the left correspond to the frequency with which a given mark is found at genomic positions corresponding to the chromatin state, annotated on the middle and assigned a colour code. Green shading indicates intensity (0–100). Genome% indicates the percentage of the genome corresponding to each chromatin state. The columns on the right show the functional enrichment of each chromatin state in cortex and pancreas-specific promoters (as selected in Figure 2) and cortex and small-intestine enhancers (as defined in (9)). (*) The sate named ‘CTCF&CohesinSA1’ contains, at least, cohesin-SA1 but it may also contain cohesin-SA2. (B) Genes were classified into quartiles according to their expression levels, obtained by RNA-seq, as follows: Q1, FPKM = 0 (n = 18 361), no expression; Q2, 0<FPKM≤0.296312 (n = 7316), low expression; Q3, 0.296312<FPKM≤6.032485 (n = 9315), moderate expression; Q4, FPKM>6.032485 (n = 9316), high expression. The frequency of the indicated chromatin states is shown for the quartiles containing expressed genes (Q1–Q3). AP, active promoters; APC, active promoters with cohesin; APCC, active promoters with cohesin and CTCF; PR, Polycomb repressed. (C) Heat-map visualization of the pairwise overlap between cerebral cortex chromatin marks and cortex-specific and non-specific (‘common’) cohesin and CTCF positions. Comparisons mentioned in the main text are highlighted by coloured rectangles.
