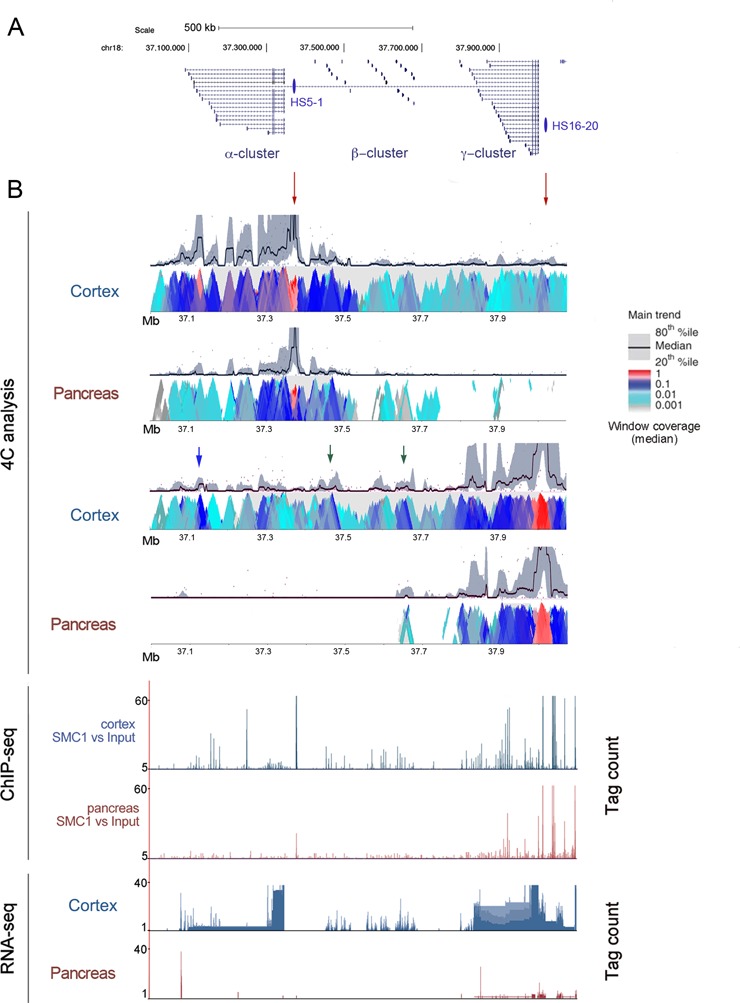
Figure 4.

Chromatin architecture of the Pcdh locus in adult cortex and pancreas. (A) Details of the chromosome 18qB3 region containing the mouse Pcdh alpha, beta and gamma clusters. HS5–1 and HS16–20 enhancer regions are shown. (B) Upper panel: chromatin interactions detected by 4C-seq in cerebral cortex and pancreas using a 20-kb window size in the main trend subpanel. Red arrowheads indicate viewpoint positions. Middle and bottom panels show cohesin positions (defined by ChIP-seq) and gene expression (obtained by RNA-seq), respectively.
