Figure 5.

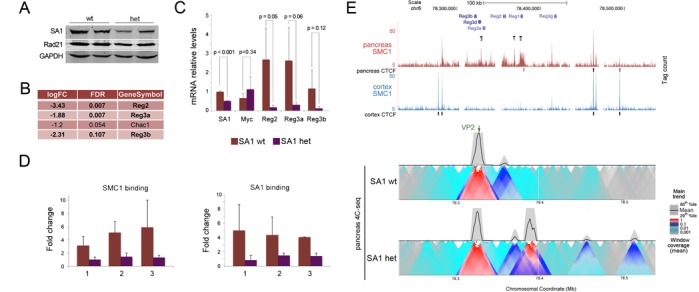
Chromatin architecture of the Reg locus in adult cortex and pancreas. (A) Levels of cohesin were assayed by immunoblot with SA1 and Rad21 antibodies in pancreas from wild-type and SA1 heterozygous mice (two individuals per genotype). GAPDH serves as loading control. (B) Table showing the four genes differentially expressed (FDR < 0.15) in pancreas from 10-week-old wild-type and SA1 heterozygous mice. (C) Validation of transcriptional changes in Reg genes by RT-qPCR. At least three individuals per condition were analysed. A two-tailed Student's t-test was applied. Data are shown as mean ± SEM (standard error of the mean). (D) The amount of cohesin SA1 and SMC1 at the sites in the Reg locus marked in (E) was analysed by ChIP-qPCR in the pancreas of wild-type and SA1 heterozygous mice. At least four animals per condition were used for the analysis. (E) Cohesin distribution across the Reg locus in cortex and pancreas, as determined by ChIP-seq. CTCF binding sites are also indicated. Black lines specify the position of primer pairs (1, 2 and 3) used in (D). The lower panel shows the analysis of the three-dimensional organization of the Reg locus in pancreas from wild-type and SA1 heterozygous mice by 4C-seq. Main trend corresponds to a 5-kb window size. The position of the viewpoint (VP2) is indicated (green arrow).
