
Figure 3.
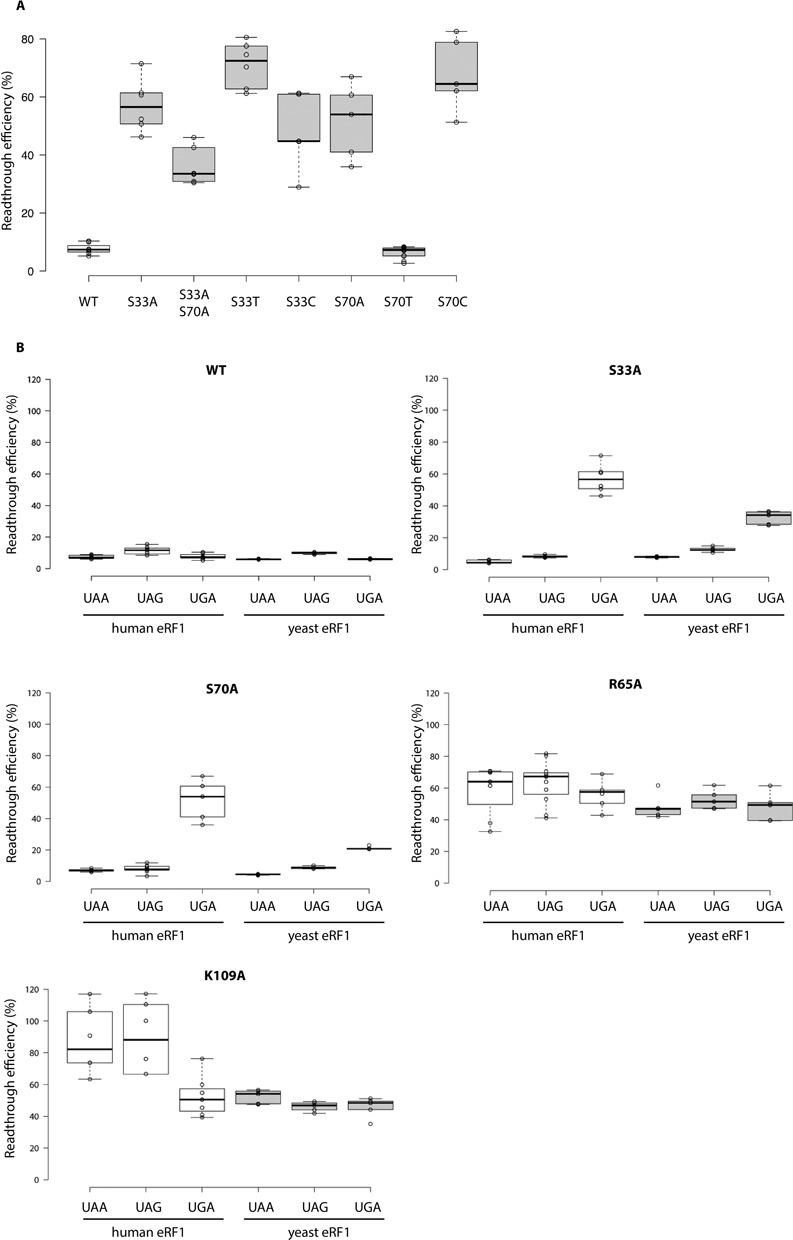
(A) Readthrough efficiency in the TMV context for alanine, threonine and cysteine mutants at positions 33 and 70, for the UGA stop codon. The lines in the centres of the boxes indicate the median values; the box limits indicate the 25th and 75th percentiles calculated with R software; the whiskers extend to the minimum and maximum values; data points are plotted as open circles. n ≥ 5 sample points. Wild-type values are indicated in white boxes; mutant protein values are indicated in grey boxes. Readthrough efficiency is shown for the UGA stop codon. Wild-type, S33A and S70A values were identical to those shown in Supplementary Figure S1. (B) Readthrough efficiency in the TMV context, for alanine mutants of the yeast and human eRF1 P1 pocket. The lines in the centres of the boxes indicate the median values; the box limits indicate the 25th and 75th percentiles calculated with R software; the whiskers extend to the minimum and maximum values; data points are plotted as open circles. n ≥ 5 sample points. The values obtained with human eRF1 are indicated in white boxes. The values obtained with the yeast eRF1 (Sup45p) are indicated in grey boxes.