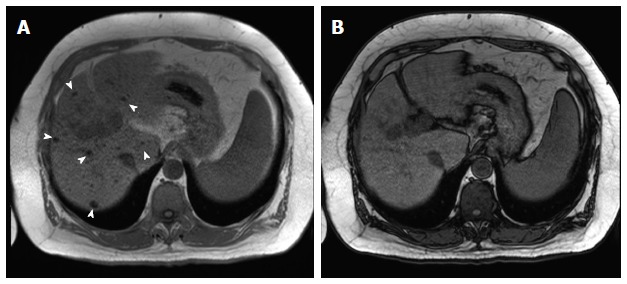
Figure 6.

Multiple siderotic hepatic nodules. In-phase (TE = 4.9 ms) (A) and opposed-phase (TE = 2.4 ms) (B) GRE T1 weighted images. There are multiple small nodules seen through out the liver, which demonstrate isosignal intensity on the in-phase images (arrowheads, A), without corresponding abnormalities on the opposed-phase images in keeping with Multiple siderotic hepatic nodules. GRE: Gradient recalled echo.
