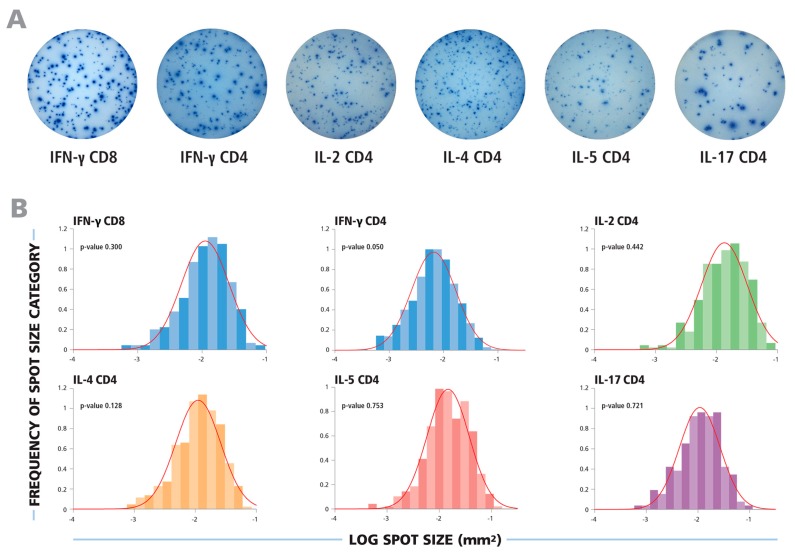
Figure 1.
The spot size distributions for different cytokines follow Log Normal function. (A) Representative images of ELISPOT wells are shown for cytokines produced by CD8 or CD4 cells, as specified. (B) The experimental size distributions of typical recall responses are shown as histograms for the specified cytokines with the theoretical Normal functions overlaid as red lines. To test for the normality of the spot size distributions, the Kolmogorov–Smirnov goodness of fit test was used.

