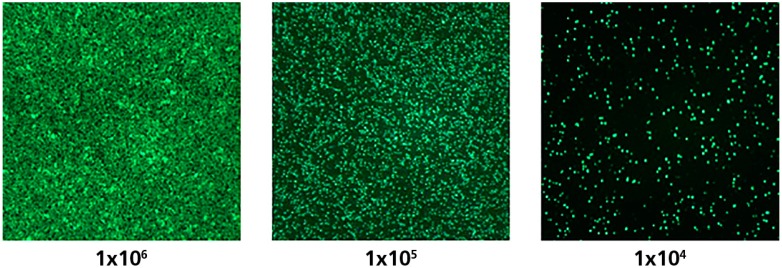
Figure 2.
PBMC were stained with fluorescent Calcein AM dye and the specified numbers of cells were plated into respective wells of a 96-well plate. The cells were visualized on an ImmunoSpot® S6 Ultimate Reader by using 480 nm as the excitation wavelength, and detecting fluorescence with a 520 ± 20 nm emission wavelength filter.

