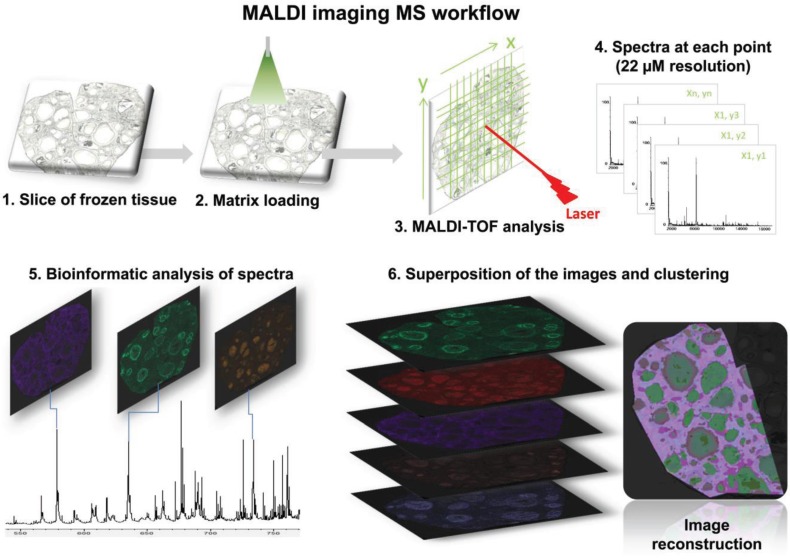
Figure 1.
Schematic representation of MALDI Mass Spectrometry Imaging (MSI) of lipids performed on fresh frozen sections of Sus scrofa gilt ovaries. Cryostat ovary section was transferred onto an ITO glass slide (1). The slide was then covered with α-CHCA or DHB (2). After matrix drying, the slide was introduced into the MALDI-TOF mass spectrometer for analysis (3). The laser scans through a set of preselected locations with a spatial resolution set at 50, 35 or 22 µm (4) generated mass spectra of lipids at each point (5). After normalization, ion density maps were created (6) for the ions, which were observed from the representative mass spectra showing the major molecular species (skyline projection spectra). Hierarchical cluster analysis displaying discriminatory signals and creating groups of related molecules based on their classification allowed the reconstruction of a molecular image (7).

