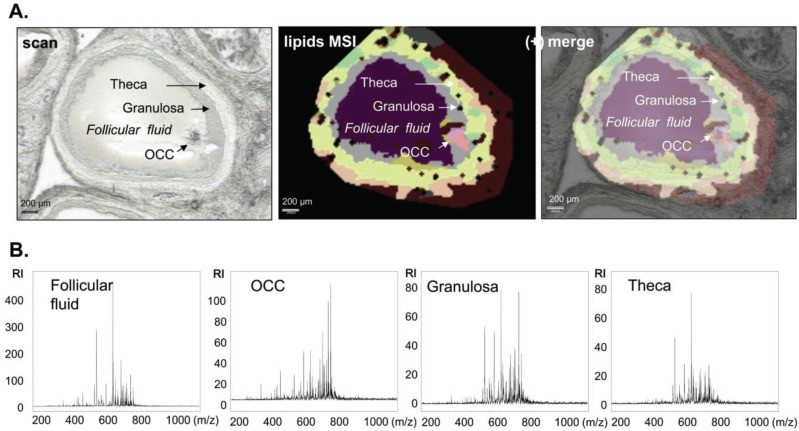
Figure 4.
Assessing spatial lipid distribution of the whole follicle from targeted MALDI MSI analysis performed in positive ion mode. (A) Histological image of follicle describing the follicular compartments (scan) and its superposition (merge) with molecular reconstruction image (lipids MSI). Scale bars = 200 µm; (B) Representative MALDI-TOF MS single spectra acquired directly from the region of interest (Follicular fluid, oocyte-cumulus complex, granulosa and theca) of porcine ovary section in the m/z 200–1000 range. RI = relative intensity.

