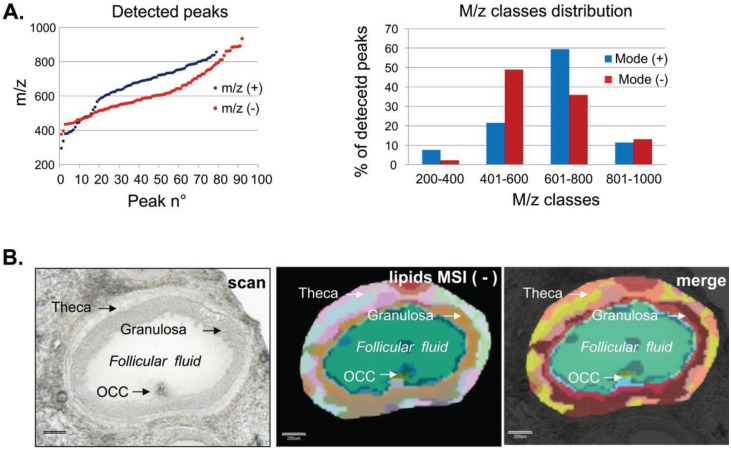
Figure 5.
(A) Comparative distribution of molecular weight (m/z) of the differential lipid species (ANOVA, p < 0.001) detected in positive (blue) and negative (red) reflector ion mode (left panel) and m/z class distributions (right panel). (B) Histological image of the follicle describing the follicular compartments (scan), molecular reconstruction image (lipids MSI) and their superposition (merge). Scale bars = 200 µm.

