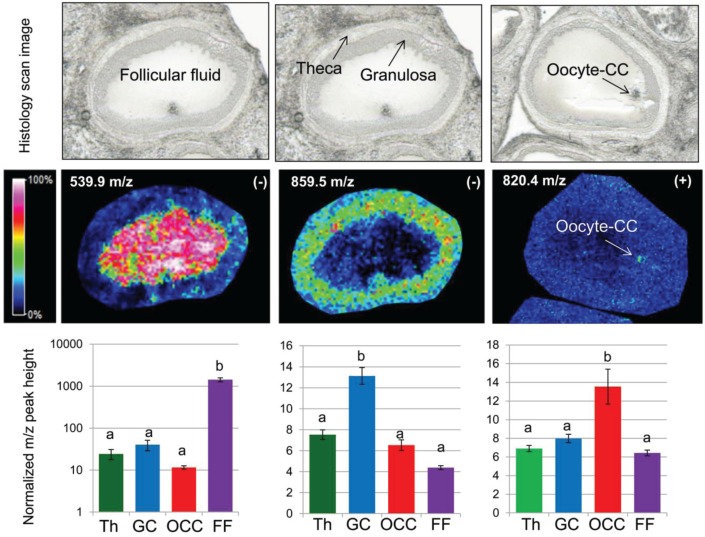
Figure 7.
Single ion intensity maps and quantification of three lipid species measured at m/z 539.9, m/z 859.5 (in negative ion mode) and at m/z 820.4 (in positive ion mode), which showed their greater abundance in different follicular compartments—follicular fluid (FF), granulosa cells (GC) and oocyte-cumulus complex (OCC)—of individual follicles. Histograms present the mean values ± standard errors (SEM) of the ion intensities (normalized peak height) measured at 12 positions throughout theca, GC, OCC and FF compartments.

