
Fig. 7.
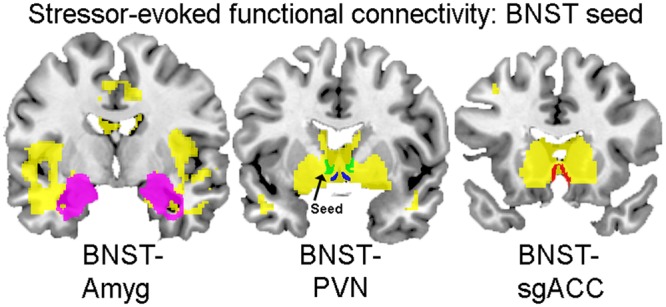
PPI main-effects map with BNST seed. Coronal sections (posterior to anterior from left to right) displaying stressor-evoked functional connectivity with the BNST seed. Voxels that are positively correlated with BNST seed activity are displayed in yellow. ROIs are overlaid to demonstrate the extent of their overlap with positively correlated voxels: Amyg (left, in magenta), BNST (middle, in green), PVN (middle, in blue) and sgACC (right, in red).