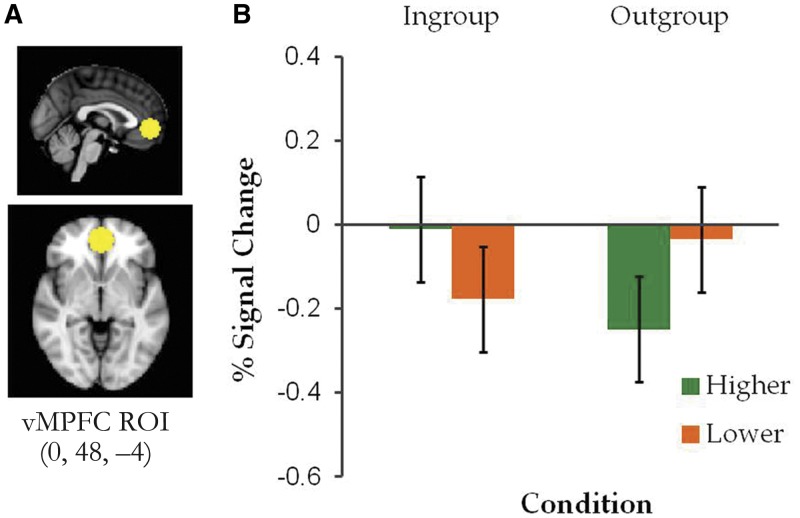
Fig. 4.
(A) vMPFC ROI derived from the self-referent > other-referent contrast in an independent trait descriptiveness rating task and (B) mean percent signal change in the vMPFC ROI as a function of condition (Ingroup or Outgroup) and post- vs pre-ownership preference change (higher or lower). Error bars represent 95% within-subject confidence intervals (Loftus and Masson, 1994).

