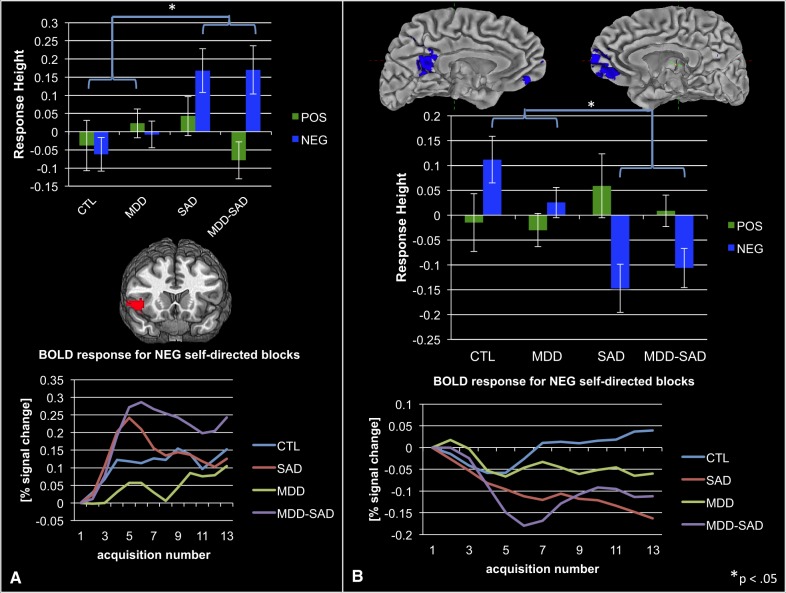
Fig. 2.
(A) Increased anterior insula response to negative self- vs other-related statements in groups with SAD, relative to groups without SAD; averaged anterior insula BOLD time series data recorded during processing of negative, self-related stimuli. (B) Decreased default-mode network responding in groups with SAD during processing of self- vs other-related negative statements; BOLD time series data from the default-mode network acquired as participants heard negative self-related statements. Note that we present neural response data from all groups, even though these results were obtained from a main-effects analysis of SAD vs non-SAD groups, to make clear to readers that main effects were driven by both SAD and MDD-SAD groups.

