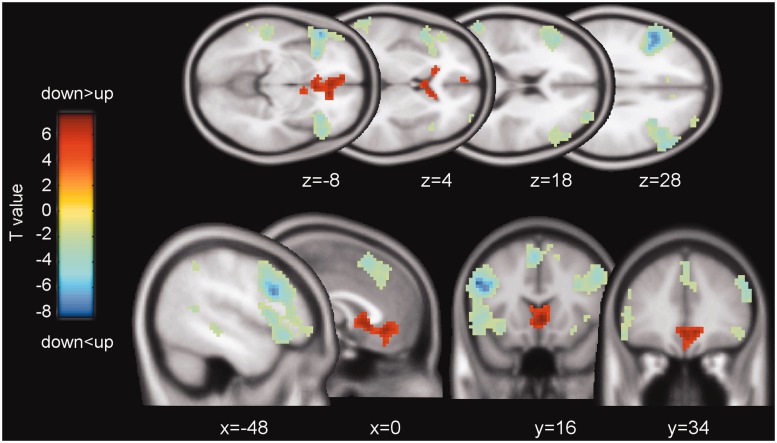
Fig. 2.
Main effect of social comparison direction. Neural activations of the contrast of downward greater than upward comparisons are shown as T-maps (P < 0.001, uncorrected, k > 10, for demonstration purposes). The effect of ‘downward > upward’ is displayed as positive T-values (red); the opposite effect of ‘downward < upward’ is displayed as negative T-values (blue). T-values are color-coded as specified by the color bar.

