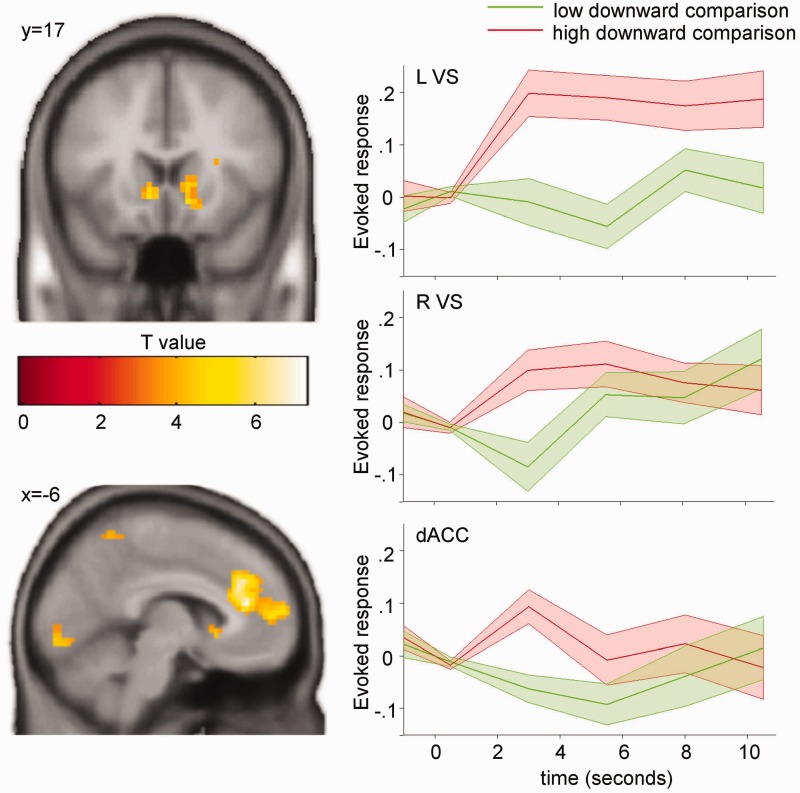
Fig. 3.
Deviation between personal and reference group performance in downward comparisons. Neural activations in the bilateral VS and the dACC increase with the positive deviation of the personal performance from the reference group performance during downward comparisons. Left, T-maps for downward comparisons modulated by the degree of deviation (P < 0.001, unc., k > 10, for demonstration purposes). T-values are color-coded as specified by the color bar. Right, peri-stimulus time histograms in the respective regions split into lower and upper percentiles of downward comparisons. Colored areas show standard errors of the mean. L, left; R, right; VS, ventral striatum; dACC, dorsal anterior cingulate cortex.

