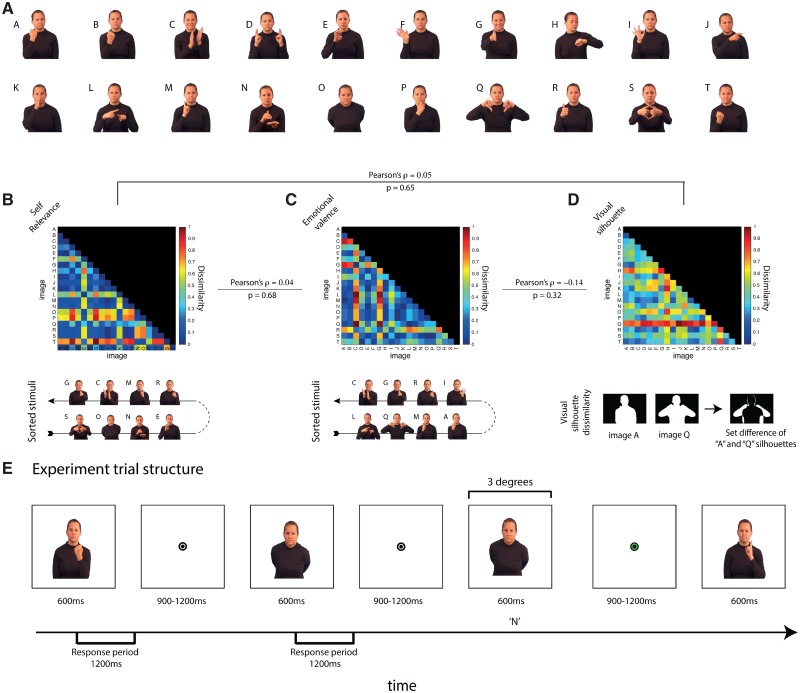
Fig. 1.
Social-communicative model and MEG experiment. (A) Stimuli. 20 images of an actress making gestures that vary in social-communicative content (B–D) The communicative model. A three-factor model including two social factors (B) self-relevance and (C) emotional valence and one visual factor (D). DSMs for each factor show the quantitative relationship between individual image pairs. Beneath the social-communicative factor, DSMs are the top four ranking and bottom four ranking images. Beneath the visual factor DSM, the computation of visual dissimilarity (the set difference of the two image silhouettes) is shown graphically. Lines connecting the DSM display the Pearson correlation between factor DSMs. (E) Experimental trial structure. Participants were shown blocks of images in pseudo random order with images repeating approximately once every 12 images in the MEG scanner. Each image was shown for 600 ms with a variable ISI between 900 and 1200 ms. The participant’s task was to detect repetitions of any image. Participants were given feedback though changes in the color of the fixation bullseye (green for successful detection/red for false alarms and misses; no feedback was provided for correct rejections) immediately after the repetition occurred.

