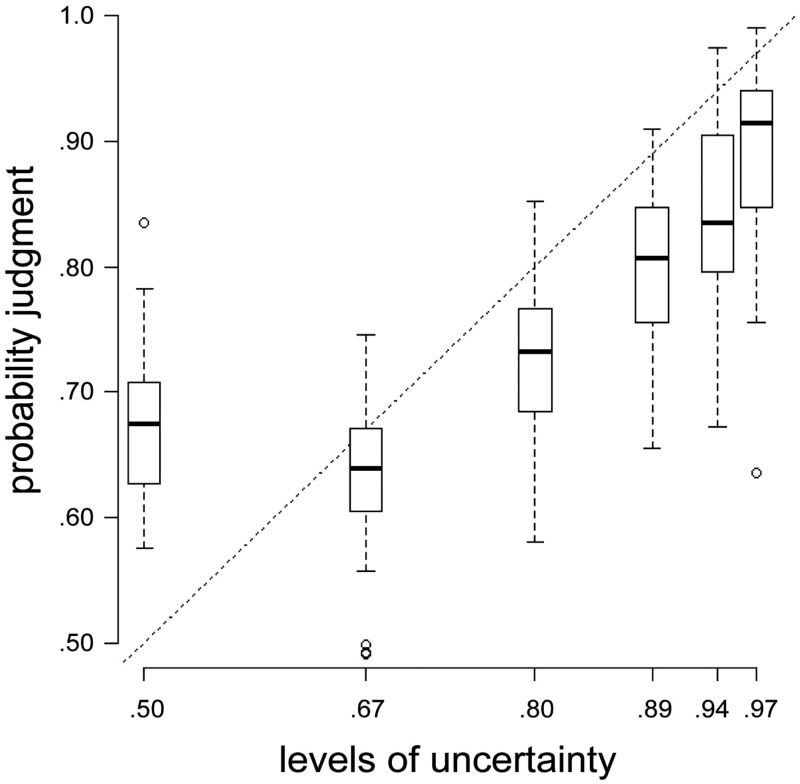
Fig. 2.
The effect of the different levels of uncertainty signaled by social and private information on participants’ probability judgments. An increase in objective certainty (x-axis) led to increased probability judgments (y-axis).
Note: the dotted line indicates the prediction of the normative Bayesian model (BM) (cf. Equation 1). The boxes range from the lower quartile to the upper quartile of the distribution. The black band in the middle of the box represents the median. The whiskers represent the minimum and the maximum of the distribution as long as these estimates are not further away from the median than ±1.5 × Interquartile range (IQR). Circles represent outliers.

