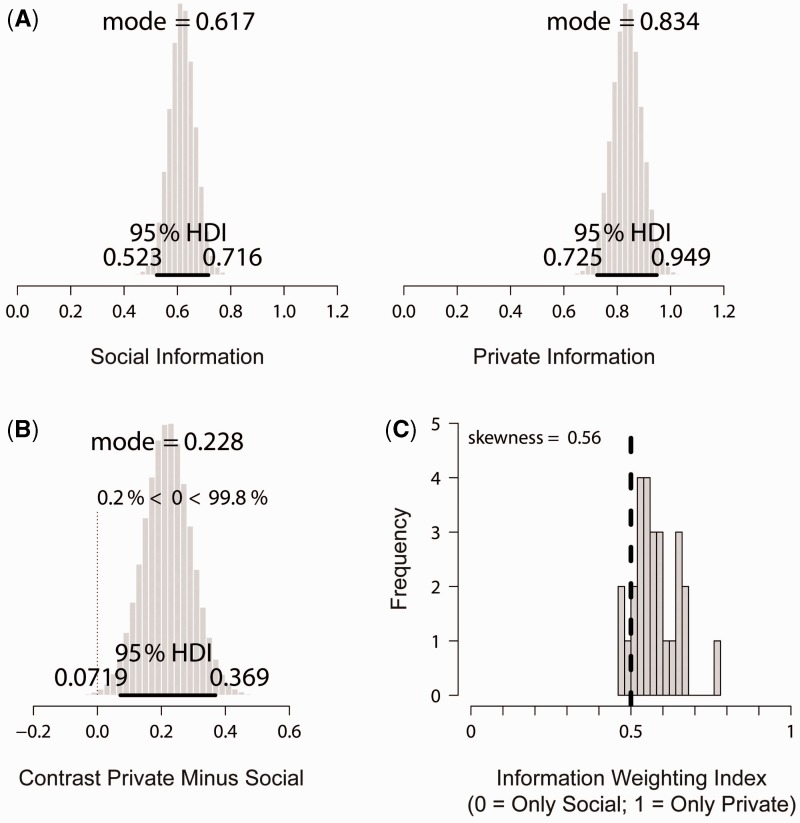
Fig. 3.
Different weighting of social and private information (SM). (A) Marginal posterior distributions for the weight of the social information () and for the weight of the private information (). (B) The contrast private information minus social information ( − ) indicates a strong difference of weighting of social and private information. (C) The distribution of the information weighting index shows that the majority of subjects overweight private as compared with social information. Note: The 95% Highest Density Interval (95% HDI) spans 95% of the distribution. The vertical dashed line indicates hypothetical unbiased information weighting (i.e. equal weighting of social and private information).

