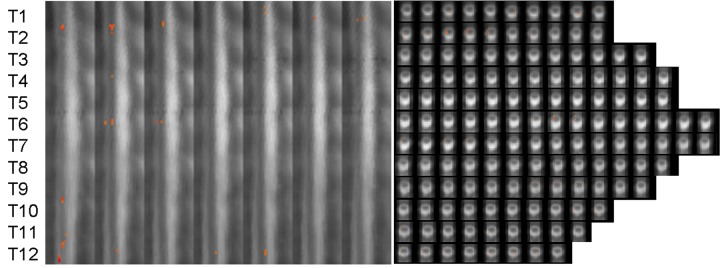
Fig. 1.

Distribution of activity elicited during the Active Negative condition. The approximate location of the thoracic spinal cord segments T1–T12 are shown on the left of the image for both the sagittal and axial orientations. In sagittal view, the slices are shown from right to left with the dorsal side of the spinal cord to the right of each frame. Axial slices are shown with the dorsal side of the spinal cord at the bottom of each frame and with the right side of the spinal cord to the left of the frame.
