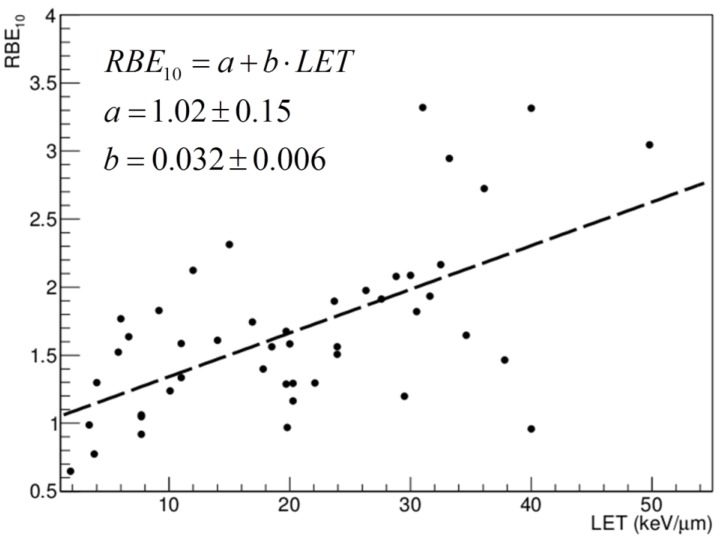
Figure 2.
RBE values for 10% survival, as extracted from PIDE [7]. The dashed line shows the tendency to an increase in RBE with LET and is the result of a linear fit. All values extracted from the database were pooled together, independent of α/β ratio. This is allowed when looking at RBE for 10% survival; the consistency of this approach was checked by separate fit analysis (not shown). Interestingly, the fit parameters are in line with those presented by Paganetti in his recent review [6]. In that case, when looking at a restricted range of dose-averaged LET<15keV/μm, the linear fit produced RBE2Gy = 1.02 + 0.052xLETd and RBE6Gy = 0.99 + 0.042xLETd.

