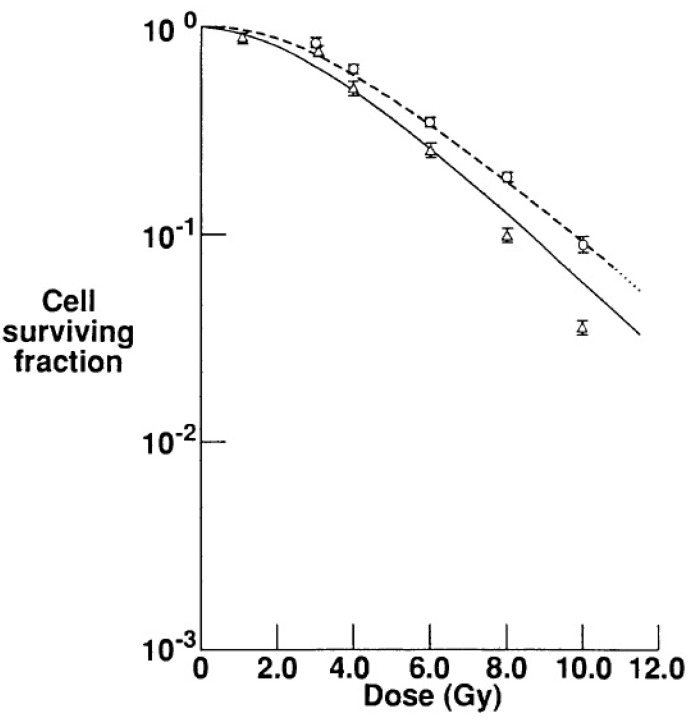
Figure 6.
Experimental data of cell inactivation obtained with CHO cells after irradiation with 60Co γ-rays (circles) and with 160 MeV protons (triangles) are shown, together with modeling analysis. The fitted curves show that γ-ray data are well described by the model when nuclear reactions are not considered (dashed line), while a good fit is obtained for proton data by including fragmentation processes in the model (solid line). Adapted from Cucinotta et al. [120].

