Figure 3.
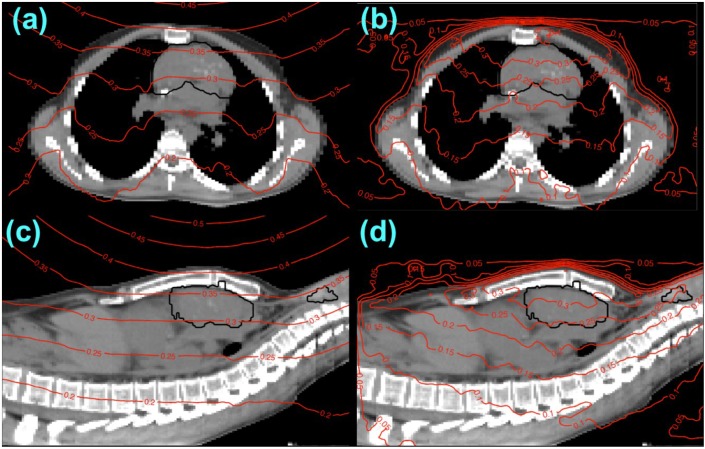
Axial (a) and (b) and sagittal (c) and (d) planes of equivalent neutron dose overlaying CT images of the HL patient, with dose calculated using the analytical H/D model (a) and (c) and the Monte Carlo H/D model (b) and (d). Equivalent dose values are percentages of the prescribed target dose. The mediastinal target volume and thyroid are indicated by black contours.

