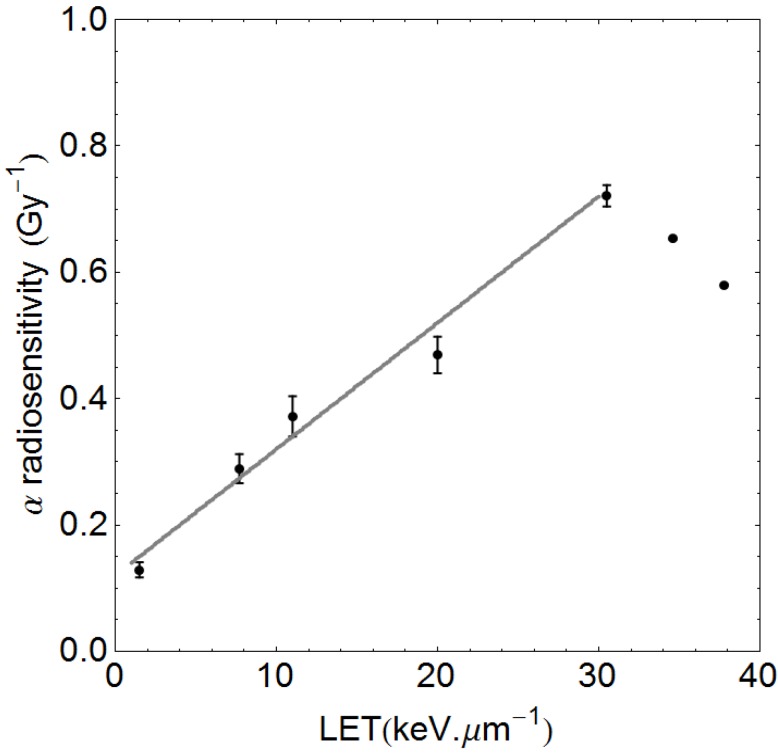
Figure 3.
Data of Belli et al. [11] showing the linear rise in α with linear energy transfer (LET), which is linear and can be fitted up to the turnover point. The least squares fitted line is αH = 0.12 + 0.02 LET, which will be unique for the V-79 cells used, where 0.12 Gy−1 is the αL value for the control radiation. The two data points beyond the turnover point are not used in the pre-turnover point slope determination.

