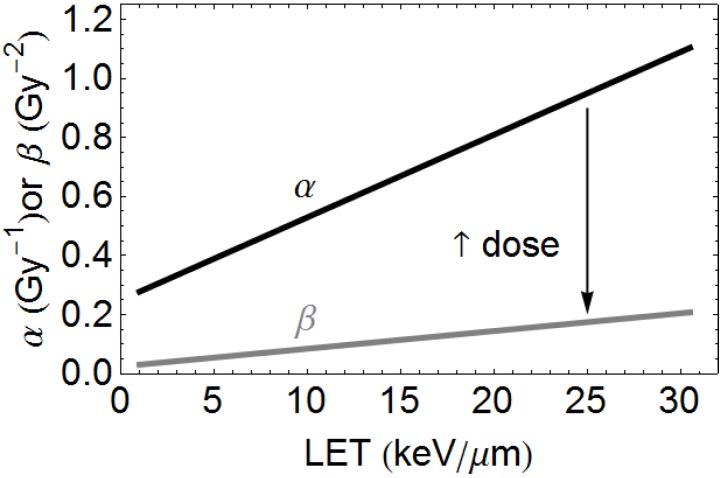
Figure A3.
Schematic diagram of change in α and β with LET to show general principles for a hypothetical case. Increasing dose will increase the proportion of β mediated cell kill and so cause a lower overall RBE, as determined by both the increment in α (which changes RBEmax) and in β (which change RBEmin), and so the relative proportions of RBEmax and RBEmin which contribute to the overall RBE. The increase in β with LET is always smaller than that in α. In this way, with increasing dose, the overall RBE follows the direction of the arrow. The numbers used in this figure are arbitrary and not intended to represent any particular cell system.

