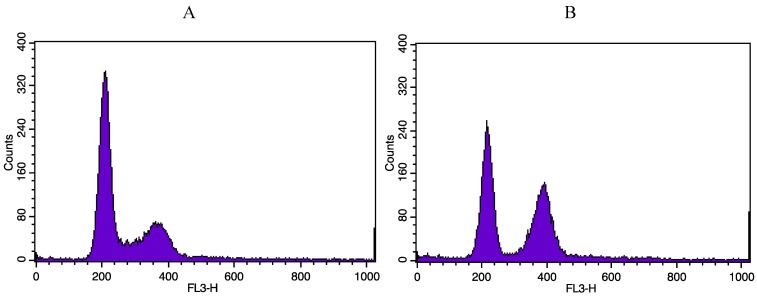
Figure A1.
Illustrative cytometry graphs obtained for monocultured A549 cells stained with propidium iodide after irradiation with 1 Gy alpha particles. (A) proportion of non-irradiated A549 cells in the different cell cycle phases. (B) proportion of A549 cells in the different cell cycle phases 24h after irradiation with 1 Gy alpha particles.

