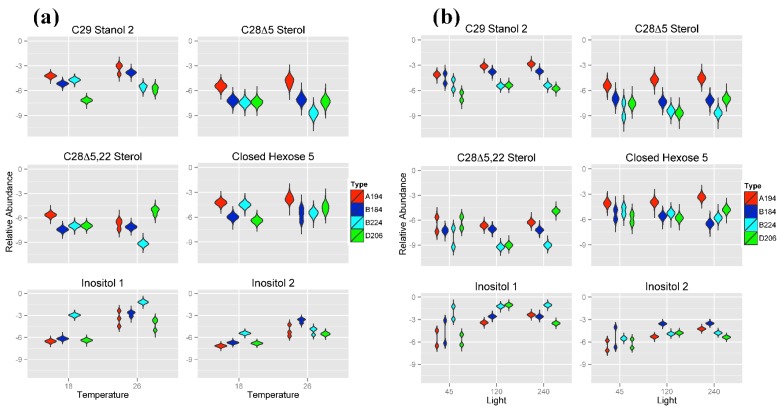
Figure 5.
Violin plots showing posterior distributions of estimates of the top six significant predictor metabolites of Symbiodinium type. Metabolite abundance values are Area Under the Curve (AUC)-normalized. Predictor metabolites are sorted from top left to lower right according to their relative importance scores derived from Random Forests analysis. Posterior distributions are grouped by (a) temperature (°C) and (b) light intensity (μmol photons m−20 s−1). The width of each figure in the violin plot is proportional to the relative frequency of values from the posterior distribution.

