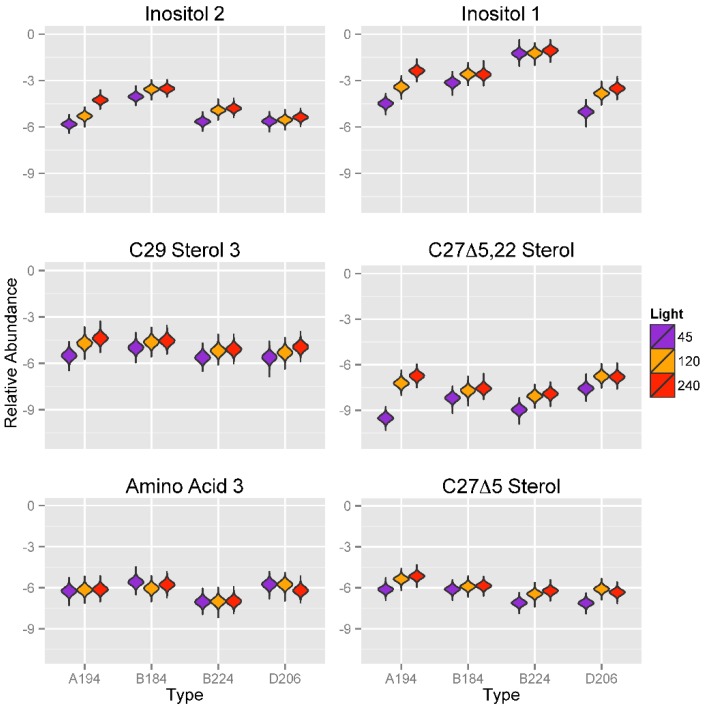
Figure 7.
Violin plots showing posterior distributions of estimates of the top six significant predictor metabolites of light intensity (μmol photons m−2 s−1) for each Symbiodinium type. Metabolite abundance values are Area Under the Curve (AUC)-normalized. Predictor metabolites are sorted from top left to lower right according to their relative importance scores derived from Random Forests analysis. The width of each figure in the violin plot is proportional to the relative frequency of values from the posterior distribution.

