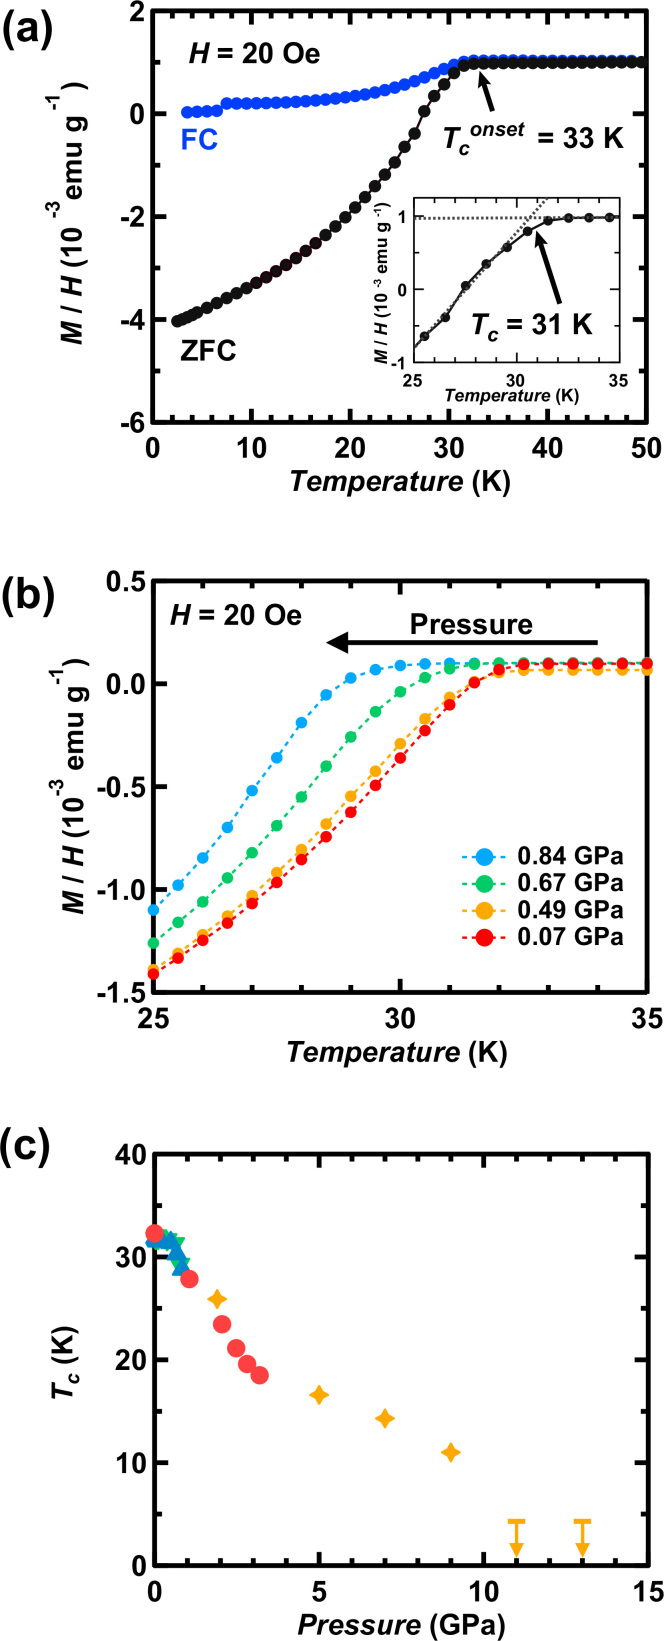
Figure 1.
(a) M/H vs. T plots for (NH3)yCs0.4FeSe (ZFC and FC modes) at ambient pressure and (b) M/H vs. T plots in ZFC mode under pressure. The inset in (a) shows how the Tc was determined. (c) Tc vs. p plot for (NH3)yCs0.4FeSe (p = 0–13 GPa), determined from the temperature dependence of M/H, χ′ and R under pressure. In (c), the Tc′s (blue (M/H in increasing p), green (M/H in lowering p) and red (χ′ in increasing p)) are determined from M/H vs. T and χ′ vs. T plots. The plots are shown in Figure 3(b) of our previous paper5. The Tc′s (orange) determined from R vs. T plots are newly plotted in (c). In (c), the arrows indicate Tc′s lower than the temperatures denoted by bars.

