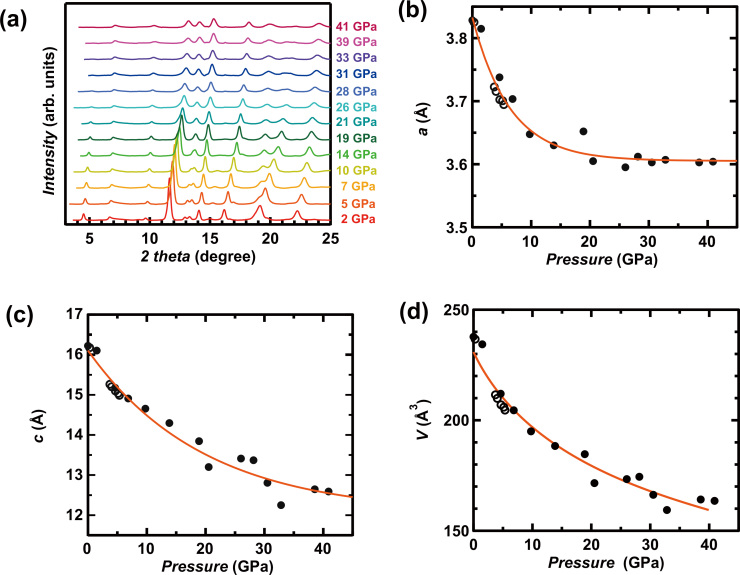
Figure 2.
(a) XRD patterns for (NH3)yCs0.4FeSe under pressure (p = 2–41 GPa). (b) and (c) Pressure dependence of a and c in (NH3)yCs0.4FeSe. In (b) and (c), the solid and open circles refer to the lattice constants determined from XRD data recorded at the Institute for High Energy physics and SPring-8, respectively. The fitting curves are drawn with a single exponential formula. (d) Pressure dependence of V in (NH3)yCs0.4FeSe is given together with the fitting curve drawn using the semi-empirical third-order Birch-Murnaghan formula.

