
Fig. 6.
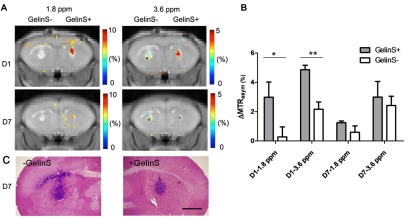
CEST MRI of gelatin hydrogel scaffold decomposition. (A) Chemical exchange saturation transfer (CEST) MR images were acquired for hyaluronic acid hydrogel implants with (GelinS+) and without (GelinS–) gelatin at day 1 (D1) and day 7 (D7) post-injection. Hydrogel implants are visible as colored pixels, with the CEST signal indicated by color scale. Left and right panels show CEST images obtained at 1.8 and 3.6 parts per million (ppm) offset from the water proton frequency, respectively. (B) Quantification of CEST contrast in the hydrogel implants shown in panel A. Values shown are the % CEST signal (% MTRasym) mean values±s.e.m. (n=4). Decomposition of gelation is seen as a decrease in % CEST signal. *P≤0.05; **P≤0.01. (C) Histological assessment at day 7 after transplantation using hematoxylin–eosin–cresyl-violet staining, in which the scaffold appears purple, showing anatomical colocalization with the MRI and proving the origin of the CEST signal. Scale bar: 1 mm. Reproduced with permission (Liang et al., 2015).