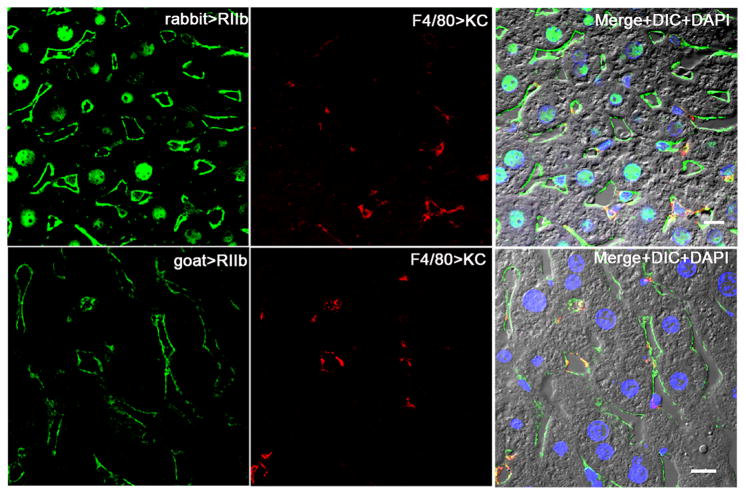
Figure 3. Within the liver most RIIb is in LSEC.
Confocal immunofluorescence images in the left column show the binding pattern of rabbit anti-mouse RIIb in the first row and goat anti-mouse RIIb in the second row (both green). In the middle column both rows show KC whereabouts with anti-F4/80 (red). The merged color images in the right column illustrate the relative abundance of RIIb expression in LSEC vs KC and show also DIC and DAPI staining of nuclei. The bars in the right column indicate 10μm.

