
Figure 6. FcRγ-chain is expressed only in KC and not in LSEC.
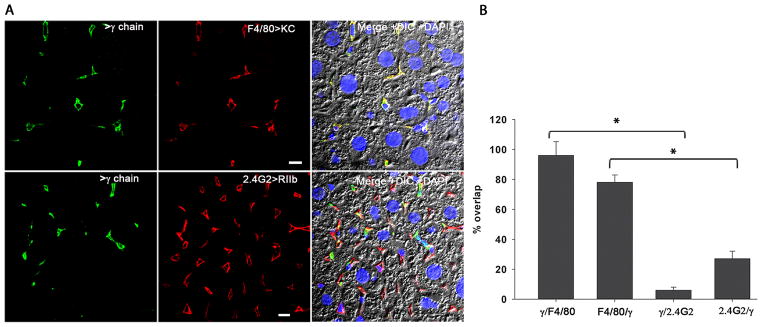
A. The confocal immunofluorescence image in the left column illustrates the expression pattern of γ-chain (green). The middle column shows the location of KC shown using anti-F4/80 (red) in the top row and the location of LSEC using mab anti-2.4G2 (red) in the bottom panel. The merged color image shows the colocalization of signal from γ-chain with signals from F-4/80 and 2.4G2 along with DIC and DAPI staining of nuclei. The bars in the middle column indicate 10μm. B. Quantitative colocalization analysis was applied to all images represented in A. The graph represents the percentage of signal from γ-chain antibody (green) colocalizing with signal from F4/80 or 2.4G2 (red) antibody and vice versa in the top panel and also for the bottom panel (mean±sd). Using a random-effects linear regression model the data from bars 1 and 3 and also between bar 2 and 4 were analyzed and the P-value was found to be <0.001.