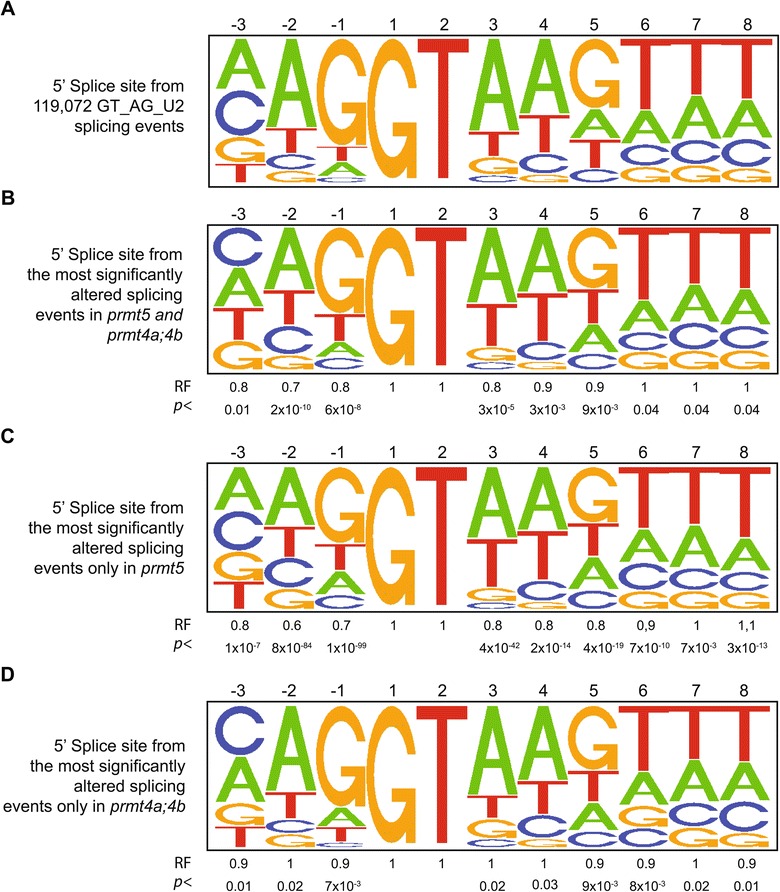
Figure 7.

Bioinformatic analysis of donor splice-site sequences. Pictograms showing the frequency distribution of nucleotides at the 5′ splice site of (A) 119,072 GT_AG_U2 Arabidopsis introns, (B) the most significantly intron retention events whose splicing were altered simultaneously in both prmt5 and prmt4a;4b, (C) the most significantly intron retention events altered only in prmt5 and (D) the most significantly intron retention events altered only in prmt4a;4b. The representation factor (RF) is the frequency in the data set of interest divided by the total frequency. For each RF a p-value was calculated using the hypergeometric test.
