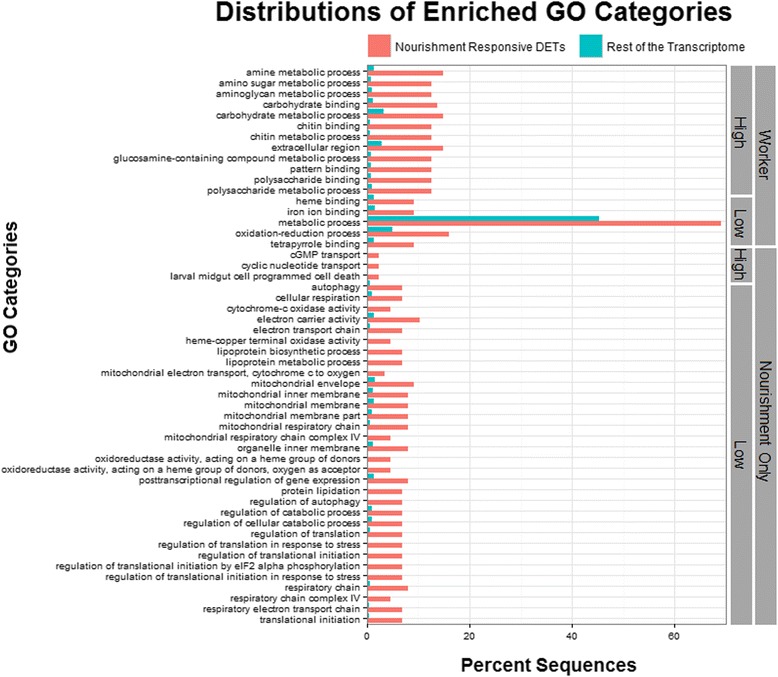
Figure 3.

Bar chart of GO categories significantly enriched (FDR < 0.05; one-tail) between nourishment differentially expressed transcripts (DETs) and remaining transcriptome. All significantly enriched GO categories were over represented in the nourishment-responsive DETs compared to the rest of the transcriptome. 17 significantly enriched GO categories were shared in common for both caste and nourishment. Directionality is indicated for the enriched GO categories and defined as the treatment group with the greater number of upregulated DETs per category.
