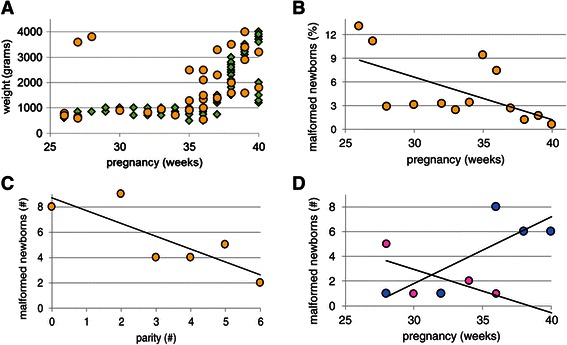
Figure 4.

Characteristics of newborns with an overt malformation. Panel A shows the birth weight of offspring with an overt malformation (yellow symbols) superimposed on that of the non-malformed population (green symbols). The risk of having a malformed newborn decreases with increasing duration of the pregnancy (panel B; R2 = 0.38) and the number of deliveries (panel C; R2 = 0.68). Panel D shows that all malformed females (pink symbols) were born prior to 36 weeks of gestation (R2 = 0.45), whereas 90% of malformed males (blue symbols) were born after 36 weeks of gestation (R2 = 0.66).
