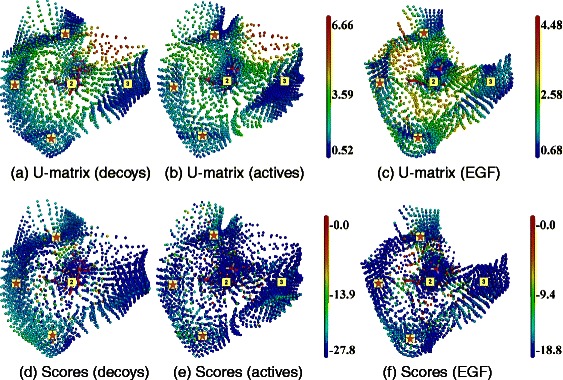
Figure 3.

SOM analysis of docking results obtained with Dock on HIV-RT. Top line, (a), (b) and (c): U-matrices; bottom line, (d), (e) and (f): docking score projections. Left column, (a) and (d): DUD-E decoys set (map dimensions (I,J,K) are (23,17,8)). Middle column, (b) and (e): DUD-E active molecules ((I,J,K) = (23,18,8)). Right column, (c) and (f)] EGF collection ((I,J,K) = (21,17,9)). Labels (2) and (3) correspond to cavity numbers used in Figure 1. They designate the AS and BS2, respectively. Regions labeled with red stars correspond to SOM regions appearing on the HIV-RT surface and considered as docking artifacts.
