Figure 4.

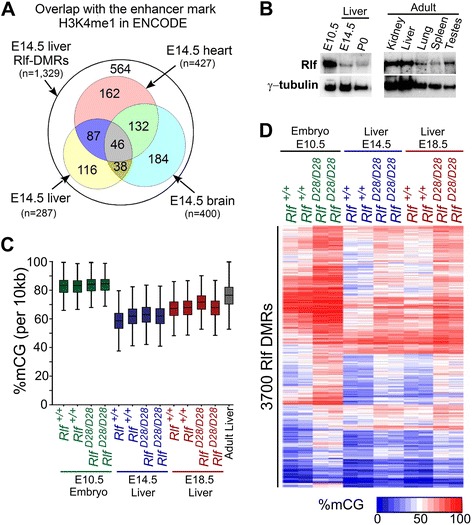
Rlf-DMRs occur across a range of tissues and developmental stages. (A) Overlap with the enhancer mark H3k4me1 in ENCODE E14.5 liver, heart and brain tissues. ChIP-seq enrichment was defined as elements with ChIP-seq RPKM greater than two-fold enriched over input RPKM for both replicates. (B) Representative Western blot showing Rlf protein expression in lysates prepared from fetal and adult wild-type mouse tissues. γ-tubulin was used as a loading control. (C) Box plots of percent mCG calculated from non-overlapping 10 kb bins for each whole genome bisulphite sequencing dataset used for this study. Additionally, the percent mCG distribution for adult liver (accession: GSM1051157); [5], obtained from the Gene Expression Omnibus [12], is included. The edges of the box-plot represent the 25th and 75th percentiles, the central bars indicate medians and whiskers indicate non-outlier extremes. (D) Hierarchical clustering showing methylation levels in E10.5 embryo, E14.5 liver and E18.5 liver for sites identified as Rlf-DMRs in E14.5 liver. Each row represents a Rlf-DMR and each data point represents the weighted average of the percent mCG for the Rlf-DMR in that sample.
