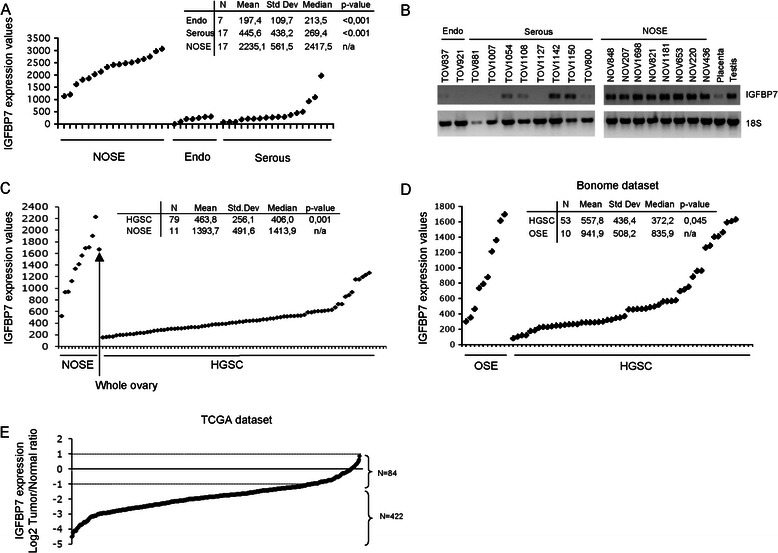
Figure 2.

IGFBP7expression profile in normal and malignant ovarian cancer samples. A, Affymetrix U133A gene expression microarray analysis of IGFBP7 in NOSE (n = 17) and TOV samples: endometrioid (Endo) (n = 7) and serous subtypes (n = 17). B, Semi-quantitative RT-PCR analysis of IGFBP7 in NOSE and TOV samples. 18S was used as an internal control. C, IGFBP7 expression in NOSE samples (n = 11), normal whole ovary and HGSC samples (n = 79) as assayed by Ziplex Research System expression array. D, IGFBP7 expression from the Bonome dataset assessed by Affymetrix U133 Plus 2.0 in cytobrushing of OSE (n = 10) and HGSC subjected to laser microdissection (n = 53). E, Log2 tumour/normal ratios of expression values for IGFBP7 gene assessed using Custom Agilent 244 K Gene Expression Microarray in 506 HGSC samples relative to the expression values derived from adjacent normal tissue or case matched peripheral blood lymphocytes (TCGA dataset).
