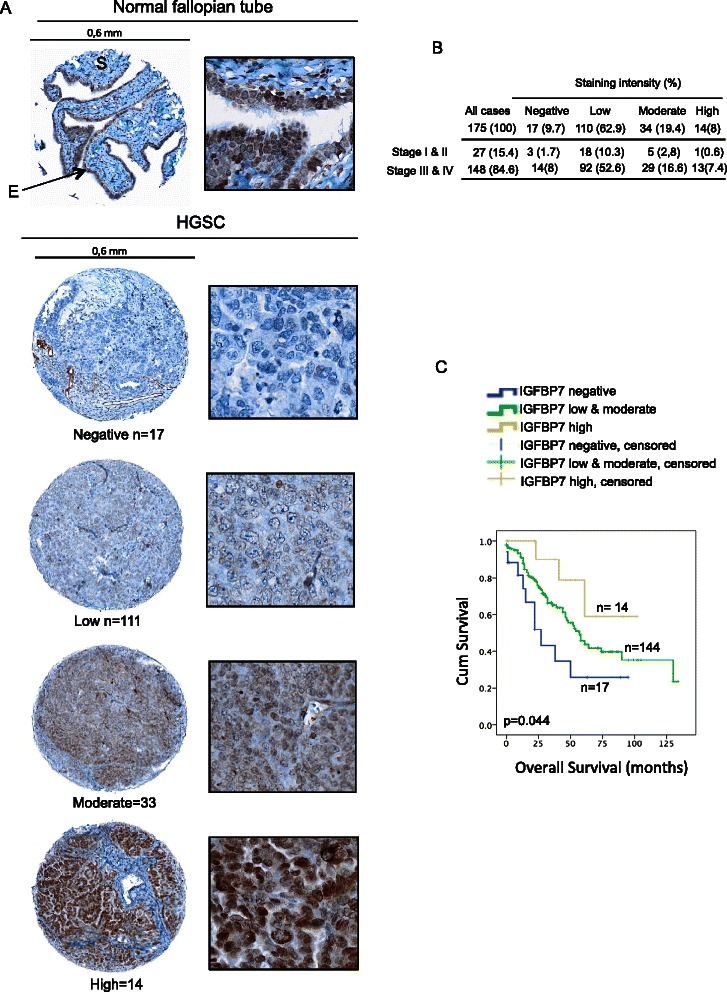
Figure 3.

IGFBP7 protein expression in high-grade serous ovarian carcinomas and normal fallopian tube samples. A, Examples of IGFBP7 staining patterns in a representative cores from a normal fallopian tube tissue sample (up panel, magnification × 20), and in cores from HGSC samples (bottom panel, magnification × 20) showing negative, low, moderate and high staining patterns. ‘E’ indicates epithelial cells and ‘S’ indicates stromal cells. Immunohistochemistry images were obtained from the OlyVIA image viewer (Olympus America Inc.). B, Percentages refer to the proportion of the 175 HGSC samples showing the staining patterns of protein expression. C, Kaplan–Meier survival curve analysis of HGSC cases for overall survival of patients whose tumours showing the following staining patterns for IGFBP7 protein: negative (n = 17), low and moderate combined (n = 144), and high (n = 14). All p-values were derived from log-rank tests.
