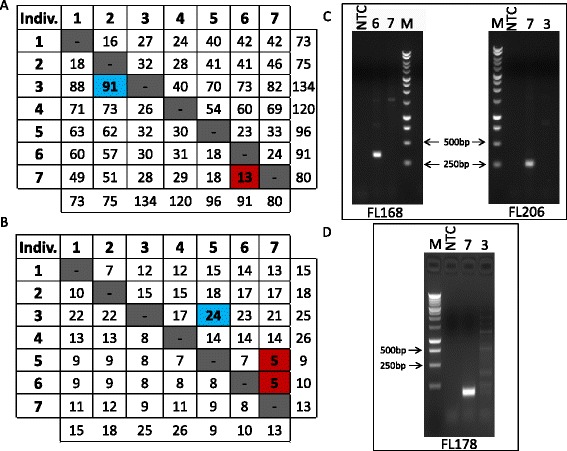
Figure 3.

Significant variation in the number of non-reference full length L1 elements is observed between individuals. (A) Two-way matrix showing the total number of polymorphic full length L1 loci present in one individual but not in another. For example, the first row represents the number of polymorphic full length L1 elements present in individual one but not in individuals two through seven (left to right). Total numbers of polymorphic full length L1 elements per individual are included at the end of each row and the bottom of each column for reference. Numbers vary from a low of 13 elements in individual seven that are not found in individual six (red square) to a high of 91 elements that are found in individual three, but are not found in individual two (blue square). (B) Similar to (A) except showing the subset of only novel (previously unreported) polymorphic full length L1 loci present in one individual but not in another. For example, the first row represents the number of novel polymorphic full length L1 elements present in individual one but not in individuals two through seven (left to right). Total numbers of novel polymorphic full length L1 elements per individual are included at the end of each row and the bottom of each column for reference. Numbers vary from a low of five elements in individuals five and six that are not found in individual seven (red squares) to a high of 24 elements that are found in individual three, but are not found in individual five (blue square). (C) Representative gels depicting 5’ flank PCR of two randomly selected non-reference full length L1 elements. Lane labels: NTC=no template control, M=1 kb DNA ladder, Arabic numerals=individual number as per Table 1. (D) Representative gel depicting 3’ flank PCR of non-reference full length L1 element. Lane labels are as in (C).
