
Figure 1.
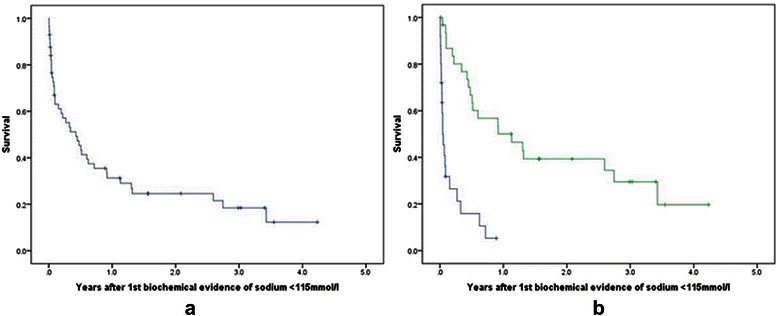
Kaplan-Meier curves for overall survival in patients developing severe hyponatraemia. a: Kaplan-Meier curve for overall survival in all patients developing severe hyponatraemia. b: Kaplan-Meier curve for overall survival in all patients developing severe hyponatraemia stratified by normalisation of sodium level.Key: Na + normalized: Green – Yes; Blue – No.