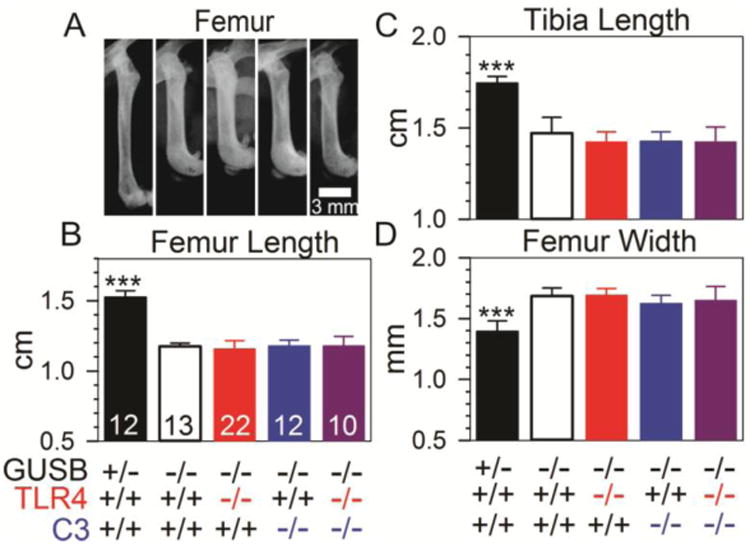
Fig. 1. Radiographical evaluation of the femur and tibia.

Radiographs of the legs were obtained. A. Representative radiographs of the femur of male mice of the indicated genotype at 3 months of age are shown. The proximal femur is at the top. B-D. Measurements of femur length, tibia length, and femur width at 3-6 months of age are shown for the indicated number of mice, which included both males and females. Statistical comparison between purebred Gusb-/- mice and the other groups used ANOVA with Holm-Sidak post-hoc analysis, and *** signifies a p-value <0.001.
