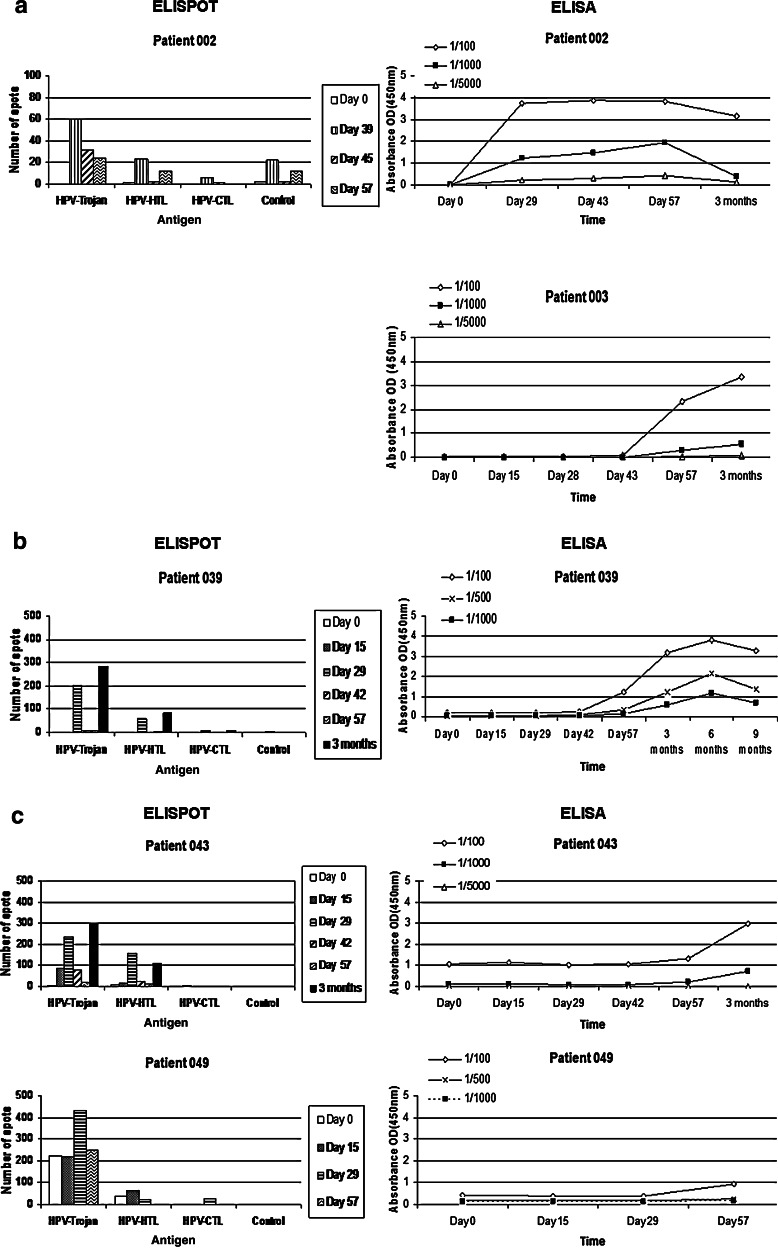
Fig. 2.
ELISPOT and ELISA results from HPV16-positive patients who had a response to vaccine. ELISPOT Assay: Collection of peripheral blood mononuclear cells (PBMCs) occurred before and after vaccination at time points shown in Figure 2. T cell reactivity measurements were carried out against human papillomavirus (HPV16)—Trojan- and individual Trojan-specific HLA class I (HPV–CTL) and Class II (HPV–HTL) using interferon-γ (IFN-γ) ELISPOT assays. Control values are shown without subtraction from experimental values. ELISPOT assays were performed with in vitro stimulation. Number of spots per 100,000 PBMCs is shown on the Y-axis. Antigen concentration was 10 μg/ml. Due to variation in response, some figures contain different increments for the Y-axis. ELISA Assay: HPV16-Trojan-specific immunoglobulin G (IgG) antibody response was evaluated before and after vaccination at time points shown in Figure 2. Absorbance data on the Y-axis represent mean optical density (OD) results from triplicate wells from three different plasma dilutions. a HPV16 500 µg cohort. b HPV16 1,000 µg cohort. c HPV16 1,500 µg cohort. *Patient 003 did not have a T cell response

